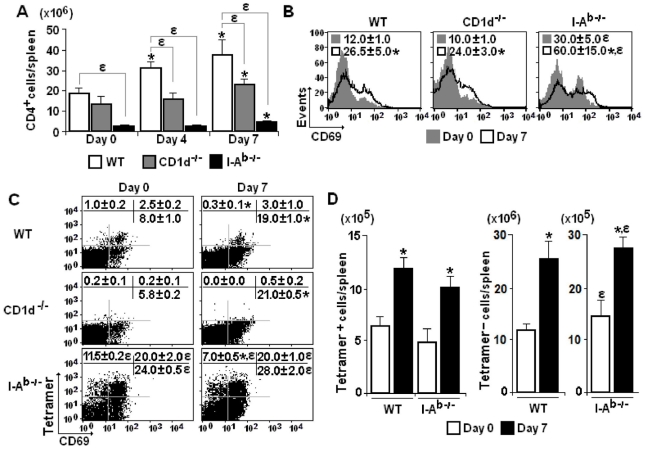
Figure 2. CD4+ cell activation in the spleen of P. chabaudi-infected WT, CD1d-/- and I-Ab-/- mice.
(A) Numbers of CD4+ cells per spleen on days 0, 4 and 7 of infection. Data represent the means ± SD (n = 6–9). (B) Histograms showing CD69 expression in gated CD4+ cells on days 0 and 7 of infection. Numbers in histograms represent the means ± SD (n = 4–6) of MFI values. (C) Dot plots showing gated CD4+ cells that recognise CD1d-α-GalCer tetramers and express CD69 molecules on days 0 and 7 of infection. Numbers in dot plots represent the means ± SD (n = 4–6) of the percentages of each subpopulation. (D) Numbers of Tetramer+CD4+ cells and Tetramer-CD4+ cells per spleen on days 0 and 7 of infection. Data represent the means ± SD (n = 6). In A–D, *, p<0.05, infected mice compared with non-infected mice; ε, p<0.05, CD1d-/- or I-Ab-/- mice compared with WT mice. Data are representative of three experiments.

