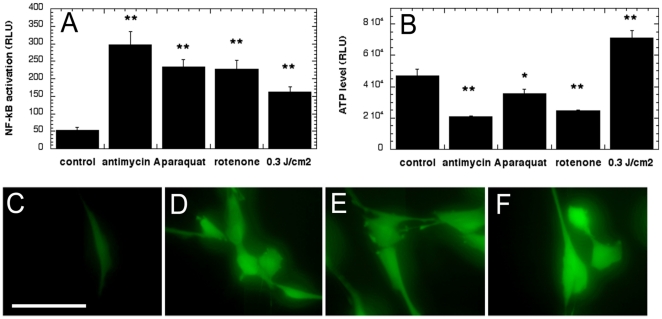
Figure 4. Mitochondrial inhibitors increase ROS and NF-kB activation in MEF but reduce ATP.
(A) NF-kB activation measured at 6 hours after 2 hour incubation with 100 µM inhibitors, (B) ATP levels measured after 2 hours incubation with 100- µM inhibitor. * p<0.05; ** p<0.01 compared to control. Inhibitors (100 µM) were added for 2 hours and CM-H2DCFDA was used to measure ROS generation at 30 min (C) control, (D) antimycin A, (E) rotenone, (F) paraquat.

