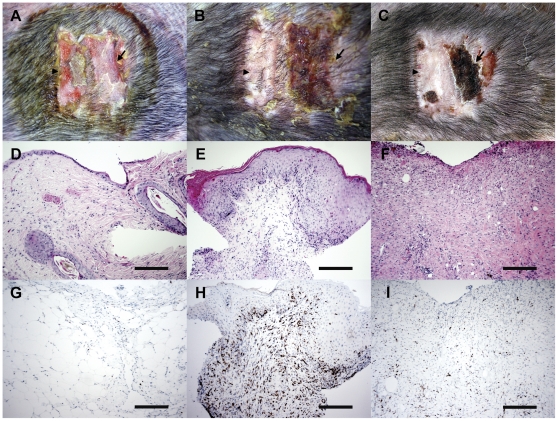
Figure 4. Skin graft between unrelated Tasmanian devils.
A–C: Macroscopic appearance of the autograft (arrowhead) and allograft (arrow), at seven, 14 and 21 days after surgery. Dark dots in the grafts are scars from punch biopsies. D–F: Histological appearance of allografts at seven, 14 and 21 days after surgery, respectively. Note extensive mononuclear infiltration at 14 days after the surgery (E), and loss of epidermis at 21 days after surgery (F). Scale bars represent 200 µm. G–I: CD3 labelling of allografts at seven, 14 and 21 days after surgery, respectively. Note the extensive CD3 infiltration at 14 days after surgery (H). Scale bars represent 200 µm.

