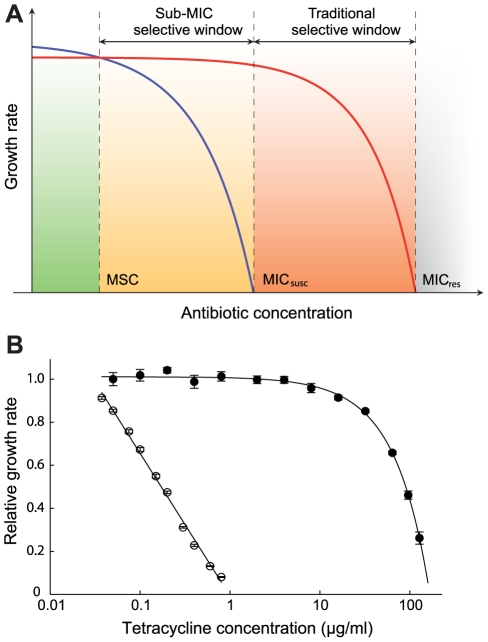
Figure 1. Growth rates as a function of antibiotic concentration.
(A) Schematic representation of growth rates as a function of antibiotic concentration. Green indicates a concentration interval where the susceptible strain (blue line) will outcompete the resistant strain (red line). Orange (sub-MIC selective window) and red (traditional mutant selective window) indicate concentration intervals where the resistant strain will outcompete the susceptible strain. MICsusc = minimal inhibitory concentration of the susceptible strain, MICres = minimal inhibitory concentration of the resistant strain and MSC = minimal selective concentration. (B). Relative exponential growth rates of susceptible (open circles) and resistant (closed circles) strains of S. typhimurium as a function of tetracycline concentration. Standard errors of the mean are indicated. A relative growth rate of 1.0 corresponds to approximately 1.8 hr−1. Cells were grown in Mueller Hinton medium at 37°C.

