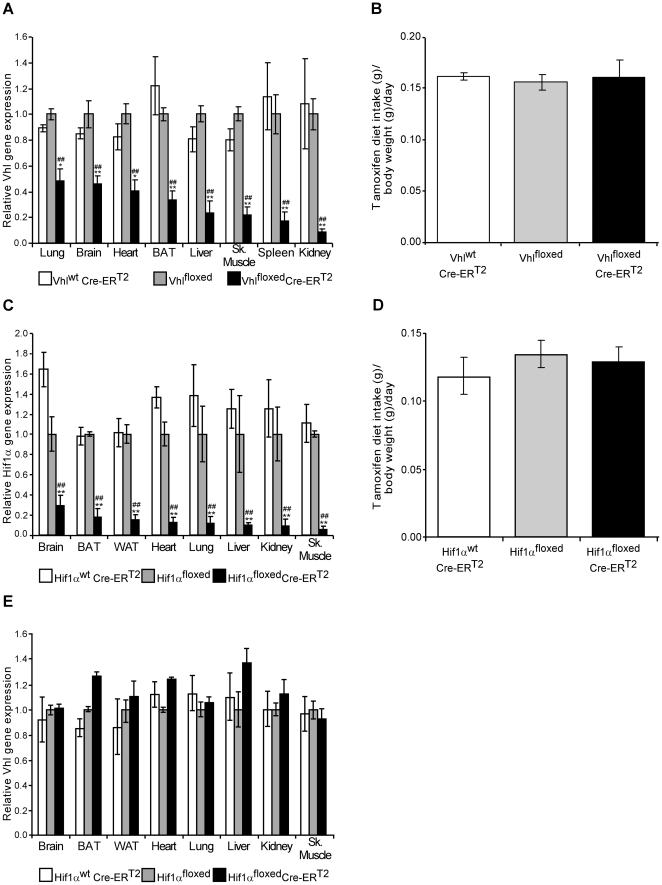
Figure 1. Vhl and Hif1α gene expression in tamoxifen-fed Vhlfloxed-UBC-Cre-ERT2 and Hif1αfloxed-UBC-Cre-ERT2 mice.
(A) Vhlwt-UBC-Cre-ERT2 (n = 3), Vhlfloxed (n = 6) and Vhlfloxed-UBC-Cre-ERT2 (n = 6) mice were placed on a tamoxifen diet for ten days followed by ten additional days on a normal diet. Gene expression was assessed by RT-PCR in the tissues indicated, the expression of the Vhl gene was normalized to that of Hprt and it was expressed as the change relative to Vhlfloxed mice. (B) Tamoxifen intake was measured over the 10 days of tamoxifen administration in Vhlwt-UBC-Cre-ERT2 (n = 3), Vhlfloxed (n = 6) and Vhlfloxed-UBC-Cre-ERT2 (n = 6) mice. (C,E) Hif1αwt-UBC-Cre-ERT2 (n = 4), Hif1αfloxed (n = 3) and Hif1αfloxed-UBC-Cre-ERT2 (n = 5) mice were administered tamoxifen as indicated above. Hif1α (C) or Vhl (E) gene expression was normalized to that of Hprt and expressed as the change relative to Hif1αfloxed mice. (D) Tamoxifen intake in Hif1αwt-UBC-Cre-ERT2 (n = 4), Hif1αfloxed (n = 3) and Hif1αfloxed-UBC-Cre-ERT2 (n = 5) mice was measured as in B. Total intake per day was expressed relative to the body weight at the end of the tamoxifen treatment and the values represent the mean ± SEM. Statistical significance was assessed using a two-tailed Student's t-test, (*, p<0.05; **, p<0.01) when comparing Vhlwt-UBC-Cre-ERT2 or Hif1αwt-UBC-Cre-ERT2 with Vhlfloxed-UBC-Cre-ERT2 or Hif1αfloxed-UBC-Cre-ERT2 respectively; (##, p<0.01) when comparing Vhlfloxed or Hif1αfloxed with Vhlfloxed-UBC-Cre-ERT2 or Hif1αfloxed-UBC-Cre-ERT2 respectively.

