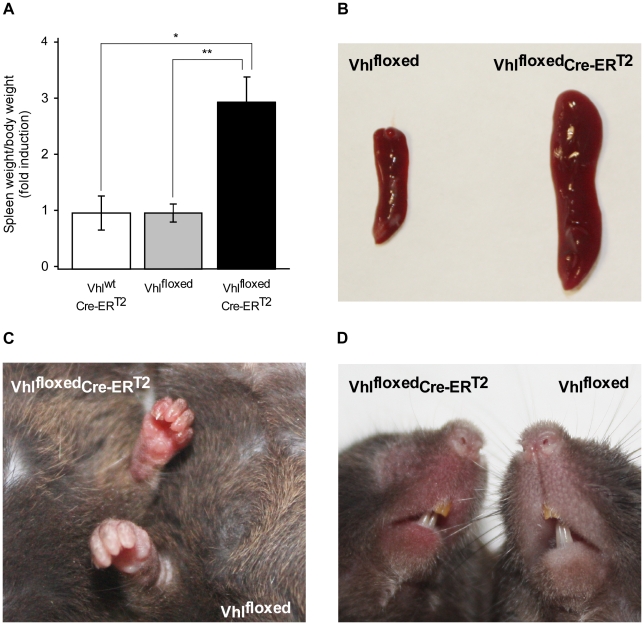
Figure 3. Gross appearance of tamoxifen-fed Vhlfloxed-Cre-ERT2 mice.
(A) Vhlwt-UBC-Cre-ERT2 (n = 3), Vhlfloxed (n = 9) and Vhlfloxed-UBC-Cre-ERT2 (n = 10) mice were administered tamoxifen as indicated in Figure 1 and the spleen/body weight ratio was then determined. Statistical significance was assessed using a two-tailed Student's t-test (*, p<0.05; **, p<0.01). Representative images of spleens (B), snouts (C) and paws (D) of Vhlfloxed-UBC-Cre-ERT2 and control Vhlfloxed mice are shown.

