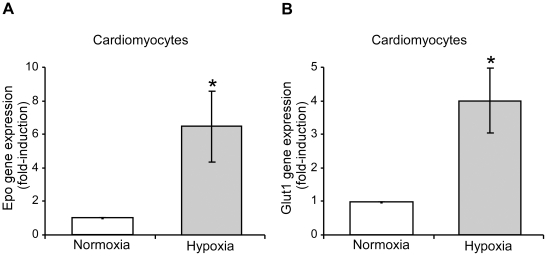
Figure 5. Erythropoietin and glucose transporter-1 gene expression in isolated primary cardiomyocytes in response to hypoxia.
Isolated rat cardiomyocyte cultures were subjected to basal normoxic conditions and/or hypoxia (1% O2) for 24 hours. Epo (A) and Glut1 (B) expression was then analyzed by RT-PCR and normalized to that of Hprt. The data from four independent experiments are expressed as the change relative to the normoxic values. Statistical significance was assessed using a two-tailed paired t-test (*, p<0.05).

