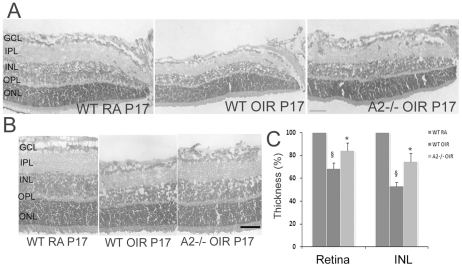
Figure 1. Retinal degeneration in WT and A2−/− mice during OIR.
A) H & E staining of retinal sections from WT RA, WT OIR and A2−/− OIR at P17 showing the markedly reduced thickness of retina and INL in WT OIR compared to WT RA, and increased thickness of retina and INL in A2−/− compared to WT OIR at P17. Scale bar 50 µm. B) Representative images used for quantifying the thickness of retina and INL. Scale bar 100 µm. C) Quantification of retinal and INL thickness. Histogram showing the relative changes in thickness of retina and INL during OIR, quantified using NIH ImageJ. In comparison with WT RA (100%), thickness of both retina and INL is significantly reduced in WT OIR (P<0.01), while they are significantly increased in A2−/− OIR compared to WT OIR. (P<0.01), Data presented as mean±SD. N = 6. § WT RA vs WT OIR, * A2−/− OIR vs WT OIR. GCL, ganglion cell layer; IPL, inner plexiform layer; INL, inner nuclear layer; OPL, outer plexiform layer; ONL, outer nuclear layer.

