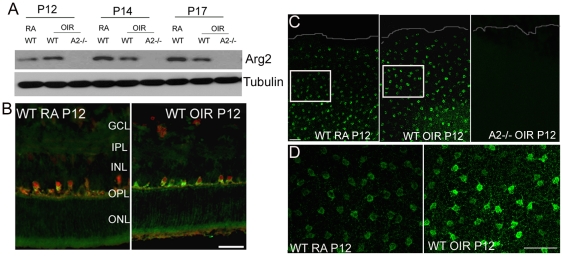
Figure 2. Expression of arginase 2 during OIR.
A) Western blot analysis showing changes in the expression of A2 during OIR. Increased expression in WT OIR was observed at P12. B) Immunohistochemistry of retinal cryostat sections at P12 showing A2 (green) expression in horizontal cells. Calbindin (red) is used as a marker for horizontal cells. Scale bar 100 µm. C) Low magnification confocal images of retinal flat mounts (periphery is outlined) from WT RA, WT OIR and A2 −/− OIR at P12 immunostained for A2 showing enhanced levels in the horizontal cells in WT OIR. White boxes represent area for high magnification images in panel D. Scale bar 100 µm. D) High magnification images of WT RA and WT OIR retinal flatmounts at P12 immunostained for A2, demonstrating increased A2 expression in the horizontal cells of WT OIR compared with WT RA. Scale bar 50 µm. A minimum of three animals was used for each experiment and representative images are shown. GCL, ganglion cell layer; IPL, inner plexiform layer; INL, inner nuclear layer; OPL, outer plexiform layer; ONL, outer nuclear layer.

