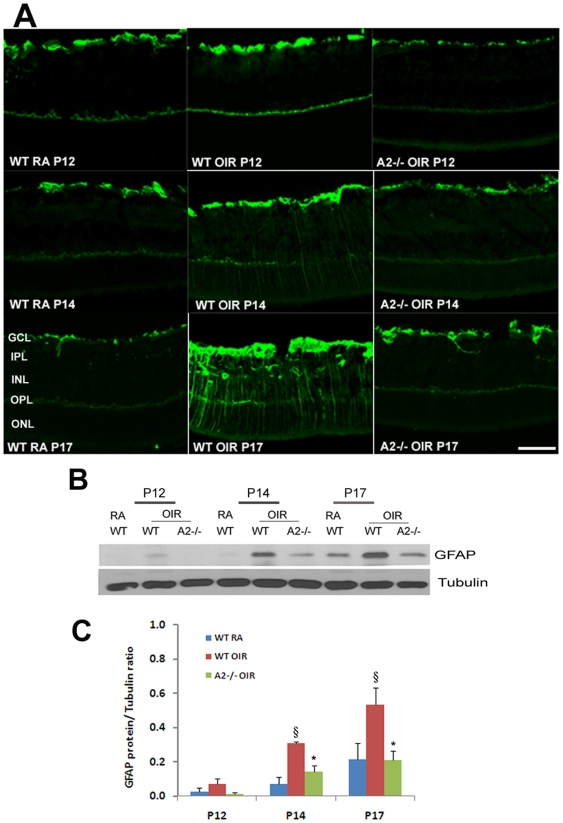
Figure 4. Decreased glial activation in A2−/− OIR retina.
A) Immunohistochemistry of retinal cryostat sections from WT RA, WT OIR and A2−/− OIR using anti- GFAP antibody at different stages of hypoxic phase. B) Western blot analysis using retinal homogenates showing the changes in GFAP expression in WT OIR retina compared to RA and A2−/− OIR during different stages. C) Quantification of GFAP expression levels in WT RA, WT OIR and A2−/− OIR at P12, P14 and P17. Data presented as mean±SD. §WT RA vs WT OIR (P<0.01), *A2−/− OIR vs WT OIR (P<0.01), N varies from 4–6. Scale bar 100 µm. GCL, ganglion cell layer; IPL, inner plexiform layer; INL, inner nuclear layer; OPL, outer plexiform layer; ONL, outer nuclear layer.

