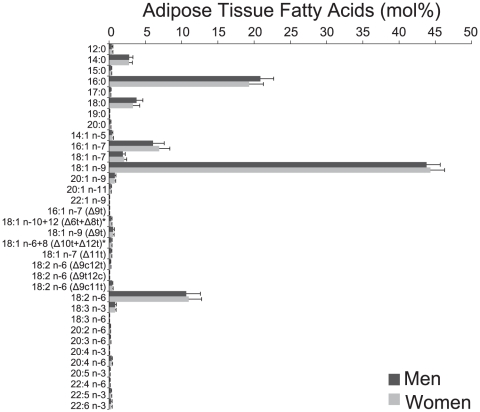
Figure 1. Adipose tissue fatty acid composition in 556 men and 544 women.
Data are expressed as mean (mol%) and error bars represent SD. Δ nomenclature in parentheses indicates the location of the double bond from the carboxyl terminal. * Peaks for 18:1n-10t and 18:1n-12t, and for18:1n-6t and 18:1n-8t, could not be separated.

