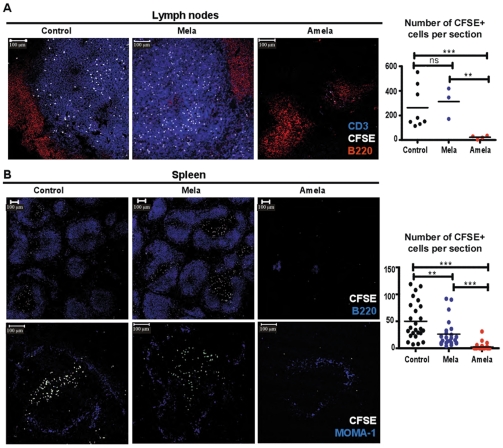
Figure 2. TL localization in TDLN of mice developing Amela-melanomas is impaired.
(A) CFSE-labeled CD8 TL from B10.D2 mice (white) were adoptively transferred into control, Mela- and Amela-bearing recipient mice. 15 hrs later their LN (A) were stained with anti-B220-PE-Texas red (red) and anti-CD3-APC (blue) and spleens (B) were stained with anti-B220-APC (blue) (upper pictures) or anti-MOMA-1-biotyl/streptavidin-Alexa647 (blue) (lower pictures) and analyzed by confocal microscopy (see Methods). The graph in (A) represents the number of CFSE+ cells per section of LN. The graph in (B) represents the number of CFSE+ cells per splenic white pulp. Number of white pulps analyzed per mouse was > or = 2. Data are from 8 (control), 3 (Mela-bearing) and 4 (Amela-bearing) mice. Statistics are as described in Methods.

