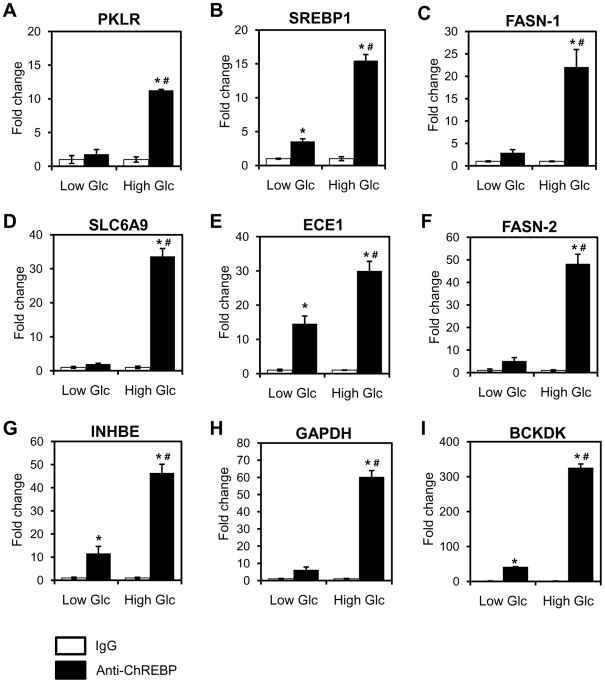
Figure 3. Effects of glucose on ChREBP binding.
HepG2 cells were treated with low (2.7 mM) and high (25 mM) glucose for 8 h. Chromatin was isolated and fragmented, and ChIP was performed with control IgG or anti-ChREBP antibody. Validated primers for each gene were used for quantitative real-time PCR. The data presented as fold increase for the signal from anti-ChREBP relative to control IgG. The negative control, Cyclo, showed no enrichment (data not shown). Values represent the mean ± S.D. of three independent samples. *p<0.005 vs. IgG, #p<0.0001 vs. 2.7 mM glucose with anti-ChREBP.

