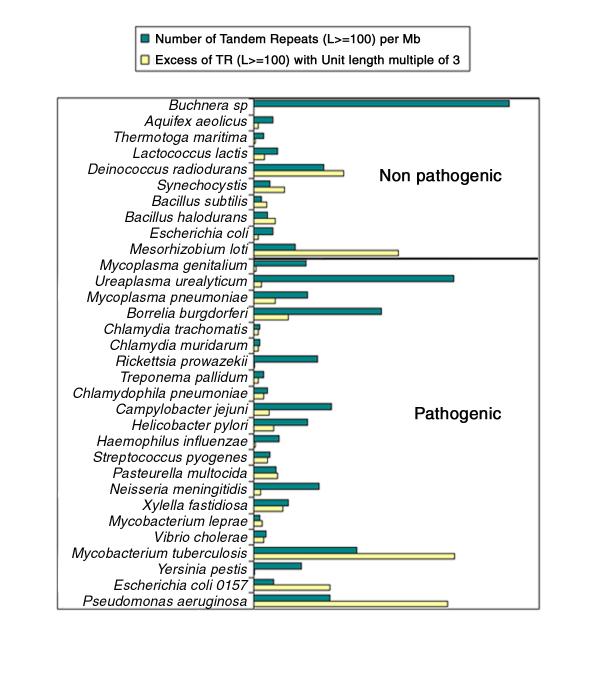
Figure 2.

Relative frequency of tandem repeats within bacterial genomes The ten non-pathogen species are listed on top. Within each category, species are ordered according to genome size (smallest genome on top). The density of tandem repeat arrays longer than 100 bp is plotted for each species (dark bars). The clear bars reflect the excess (χ2 values) of tandem repeats with a repeat unit length multiple of three.
