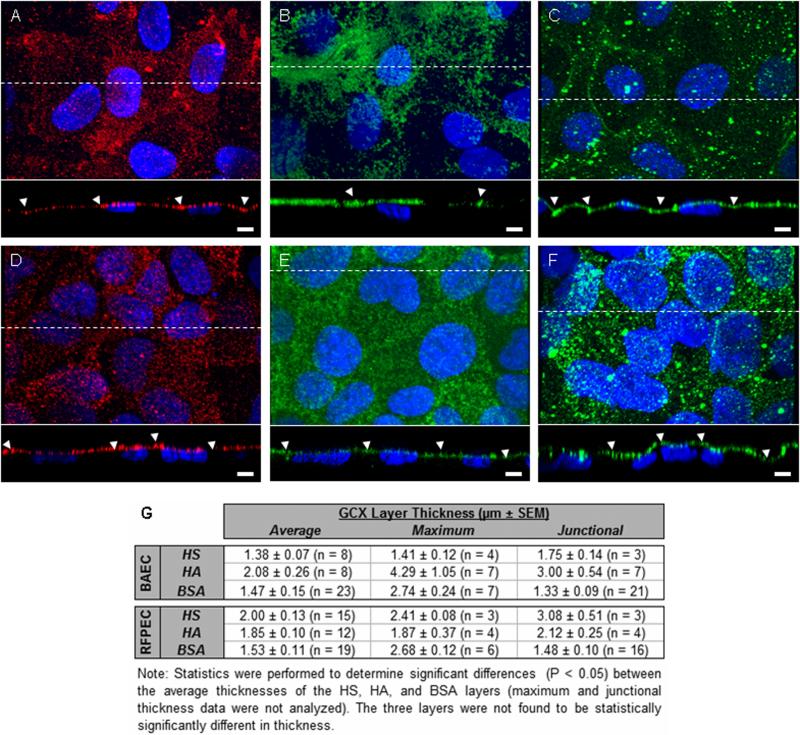
Figure 4.
Confocal micrographs of EC HS (red), HA (green), BSA (green), and nucleii (blue). (A) BAEC HS, (B) BAEC HA, (C) BAEC BSA, (D) RFPEC HS, (E) RFPEC HA, and (F) RFPEC BSA are shown. Bar = 5 um. (G) Average ± SEM GCX thickness (n = GCX-covered EC nucleii), maximum GCX thickness per cross-section, and junctional GCX thickness. Arrowheads: locations of cell-to-cell junctions.

