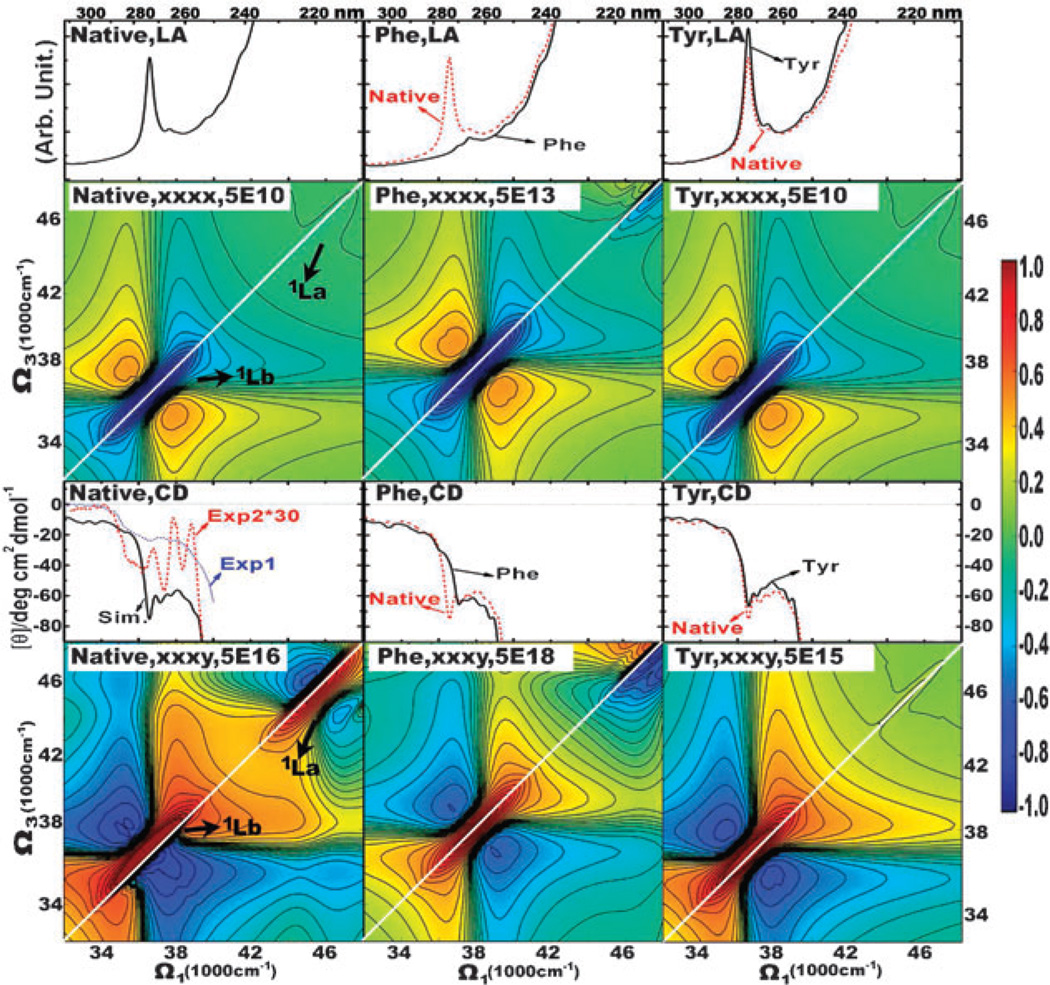
Fig. 5.
Left column: spectra of the native Aβ9–40 fibril. From top to bottom: LA, non-chiral (xxxx) 2DNUV signal, CD, chiral (xxxy) 2DNUV signal. 1D and 2D signals are averaged over 1000 and 500 MD snapshots, respectively. Blue dotted and red dashed lines in the CD of the fibrils are experimental spectra exp153 and exp2 (multiplied by 30),54 respectively. 2DNUV signals are displayed with a nonlinear scale (eqn (6)), the scale factor c is given on the top, red signals are positive and blue signals are negative, and a white diagonal line is drawn to reveal the symmetry of signals. 2DNUV scale bar is plotted at the right edge. Middle and right columns: same as the left column but only for the Phe and Tyr residues, respectively.

