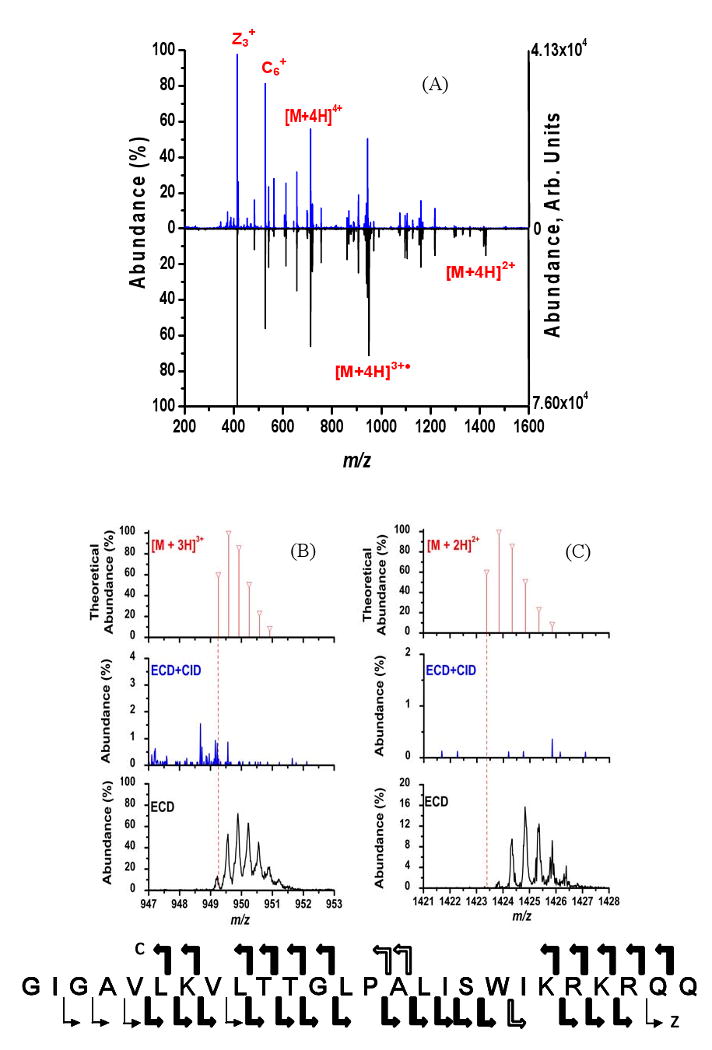
Figure 5.

(A) ECD+CID spectrum (upward) and ECD spectrum (downward) of [M+4H]4+ of melittin. The amino acid sequence for melittin at the bottom of the figure indicates the cleavage sites and is annotated the same as in Figure 2. (B and C) Expanded mass-to-charge regions around melittin [M+4H]3+• and [M+4H]2+, respectively, from 5A. The theoretical isotopic distributions expected if the charge states were formed directly from ESI are given for [M+3H]3+ and [M+2H]2+ ion the top spectra. The middle spectra are these mass-to-charge regions for the ECD+CID experiment and the bottom spectra are the same mass-to-charge regions for just the ECD spectra.
