
Figure 2.
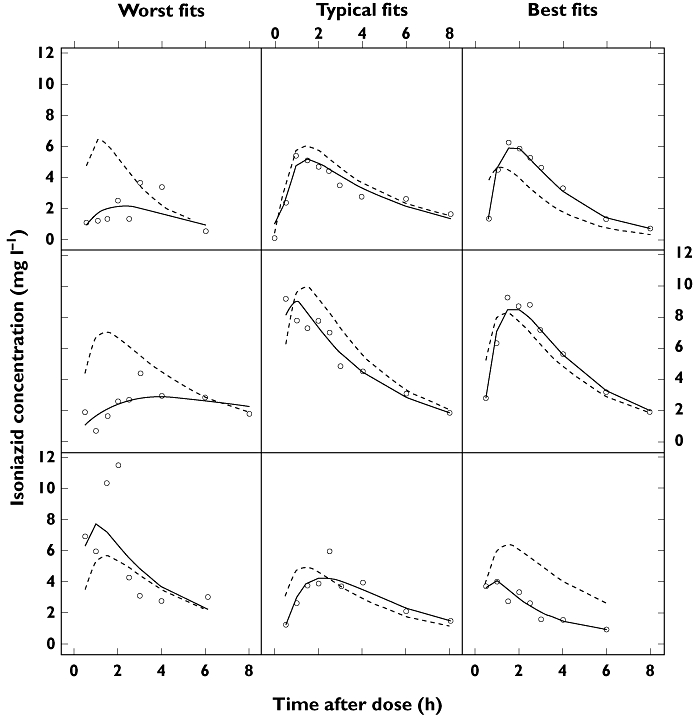
Plots of the observations (open circles), individual predictions (solid lines) and population predictions (dotted lines) from the final pharmacokinetic model, to illustrate goodness-of-fit for fast absorbers and slow absorbers. ‘Worst fit’, ‘Typical fit’ and ‘Best fit’ denote degree of goodness-of-fit, categorized by the median of the absolute weighted individual residuals (IWRES) in each individual. C = isoniazid plasma concentration