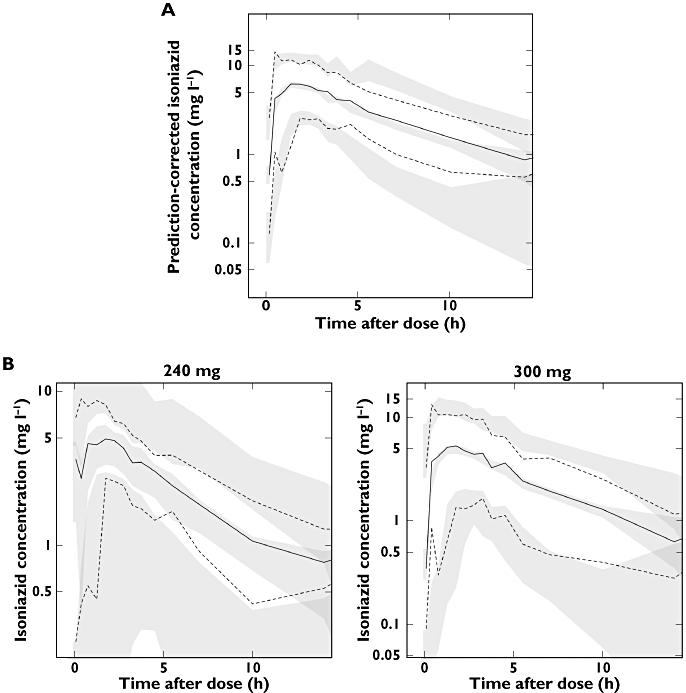
Figure 3.

(A) A prediction-corrected visual predictive check (PC-VPC) and (B) VPCs stratified for 240 mg and 300 mg doses. The open circles are the observed data points, solid lines are the 2.5th, 50th and 97.5th percentiles of the observations (binned by time interval), dashed lines are the 2.5th, 50th and 97.5th percentiles of the simulated data, and the shaded regions represent the 95% confidence intervals for the simulation percentiles)
