
Figure 4.
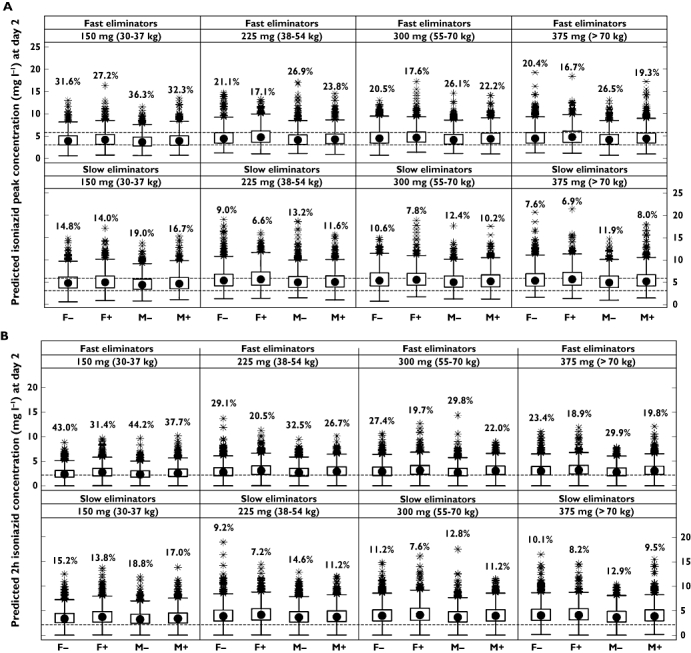

Distribution of simulated pharmacokinetic metrics after 2 days of continuous dosing in fast and slow eliminators using doses based on current WHO guidelines (5 mg kg−1 body weight), stratified by eliminator status and weight-based dosing band (30–37 kg = 150 mg, 38–54 kg = 225 mg, 55–70 kg = 300 mg, >70 kg = 375 mg). (A) Isoniazid peak concentration (Cmax); percentages are the number of Cmax values under 3 mg l−1; dashed horizontal lines represent the ‘normal range’ of 3–6 mg l−1. (B) Isoniazid concentration at 2 h post-dose; percentages are the number of concentrations under 2.19 mg l−1 (represented by the dashed horizontal line), the threshold associated with 90% of maximal EBA. (C) Isoniazid area under the curve (AUC(0,∞)); percentages are the number of concentrations under 10.52 mg l−1 h (represented by the dashed horizontal line), the threshold associated with 90% of maximal EBA. Solid circles are medians, open circles are outliers, boxes represent the interquartile range, and whiskers extend to the most extreme data point which is no more than 1.5 times the length of the box away from the box