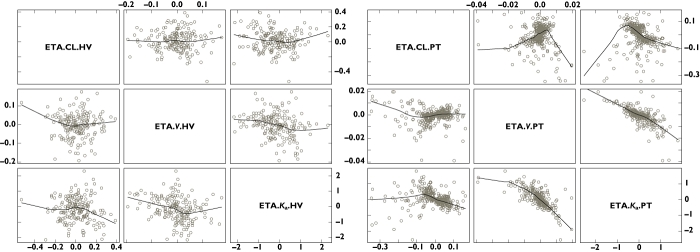
Figure 5.
Scatter plots of the empirical Bayesian estimates in the final model in healthy subjects (left panel; ETA.CL.HV =ηCL/F, ETA.V.HV =ηV/F and ETA.ka.HV =ηka) and patients (right panel; ETA.CL.PT =ηCL/F, ETA.V.PT =ηV/F and ETA.ka.PT =ηka). Each line indicates a nonparametric regression with robust local linear fit

