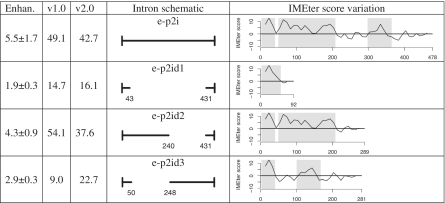
Figure 2.
IMEter analysis of PRF2 deletions. First column lists expression enhancement relative to an intronless control. Second and third columns show IMEter scores (using version 1.0 and 2.0) for each intron. Fourth column shows a schematic representation of the hybrid structure, with the original construct names provided. The final column shows IMEter score density computed in 50 nt windows, gray regions correspond to peaks of high IMEter score predicted by IMEter v2.0.

