Figure 4.
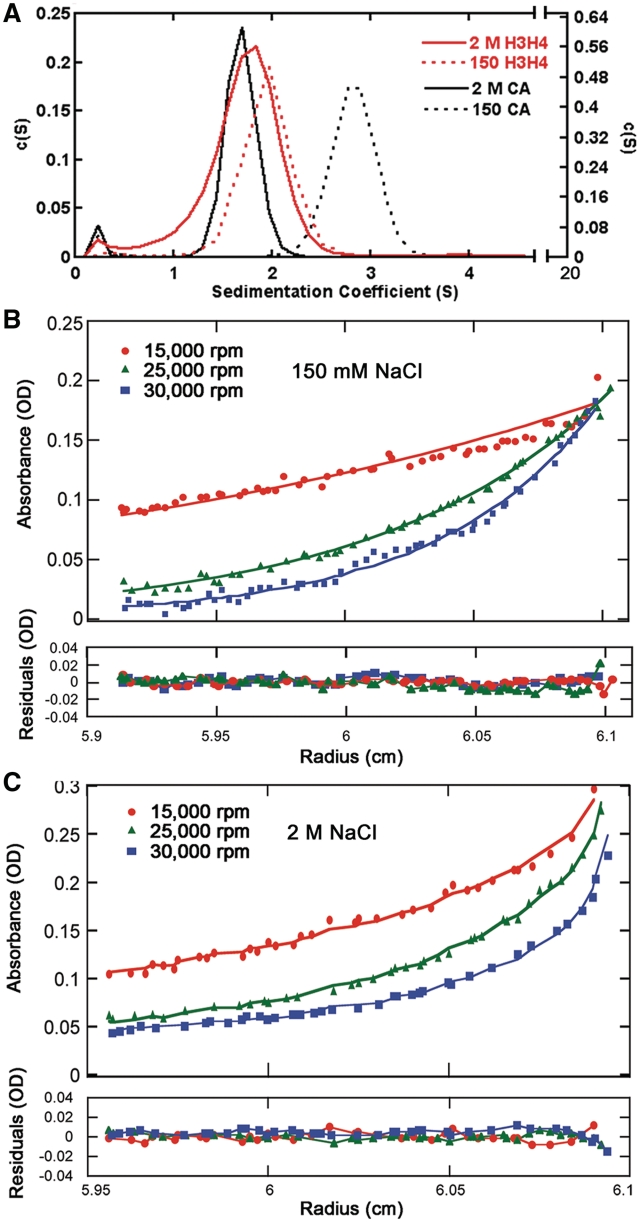
Analytical ultracentrifugation of H3/H4 at different ionic strengths. (A) Sedimentation velocity AUC analysis of H3/H4. The normalized c(s) distribution curves calculated from the raw data using SEDFIT (44) are shown for H3/H4 at 10 µM (dimer in red) and carbonic anhydrase (CA in black) in buffers containing 2 M NaCl (solid line) and 150 mM NaCl (dotted line), respectively. (B and C) Sedimentation equilibrium concentration profiles of H3/H4 were measured in buffers with 150 mM (B) and 2 M (C) NaCl concentrations, respectively. The absorption profile was recorded at 280 nm at three rotor speeds each: 15 000 rpm (red circle), 25 000 rpm (green triangle), and 30 000 rpm (blue square). The continuous line is the non-linear least-squares global fit to a single exponential function, with single species having a molecular masses shown in Table 2, as analyzed with SEDPHAT (45).

