Figure 6.
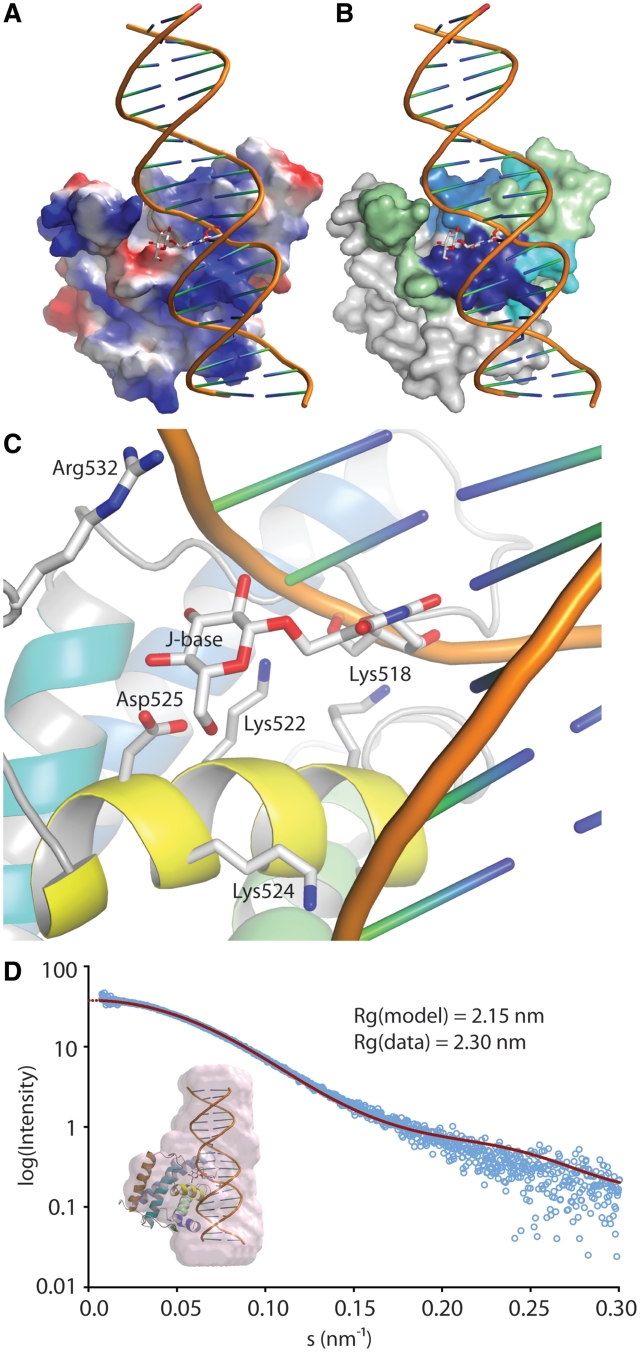
A model of JBP1 binding to J-DNA. (A) JBP1 is shown as a surface colored by electrostatic potential; J-DNA is shown as a cartoon with the J-base as stock model; while the DNA backbone runs along the positive (blue) patch in the JBP1 surface, the J-base faces a negative (red) ‘island’. (B) Same as in A but the JBP1 surface is colored by the propensity of peptides to interact with J-DNA according to the HDX-MS experiments, like in Figure 4A. (C) A close up of the interaction of JBP1 with the J-base; the residues important for interaction according to mutagenesis studies are shown as stick models and are labeled. (D) Validation of the model against SAXS data; the graph shows the intensity calculated from the model (red line) and the experimental data (open cyan circles) against the scattering amplitude; in the inlet picture the pink surface represent an ab initio beads model calculated from the SAXS data and superposed onto the JBP1:J-DNA complex model.

