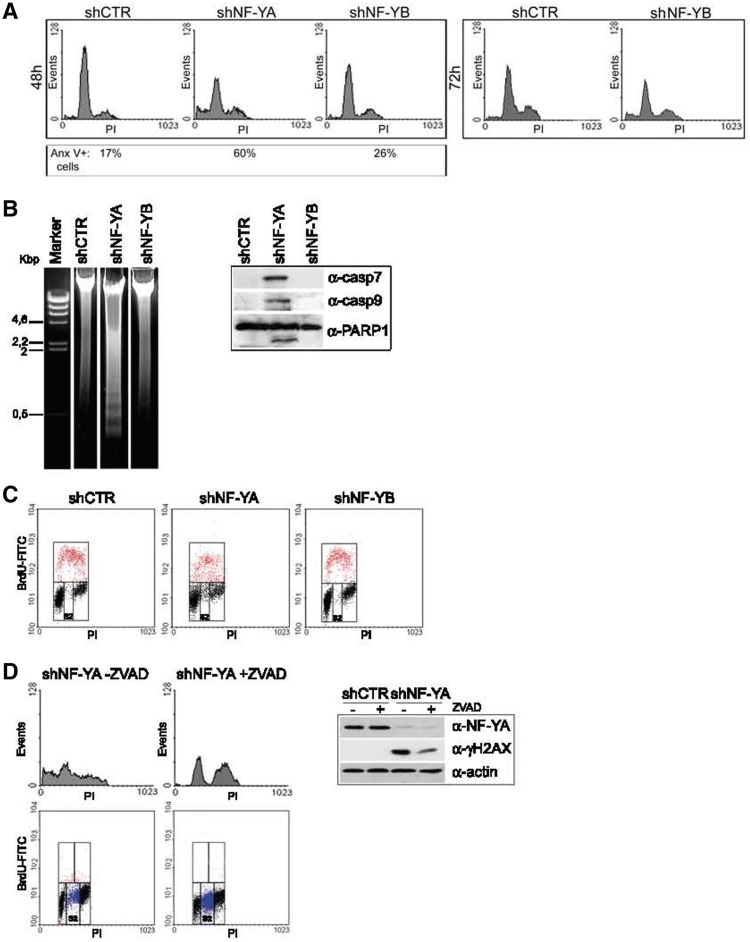
Figure 2.
(A) PI/monoparametric FACS analysis of HCT116 cells after 48 h of infection with shCTR, shNF-YA and shNF-YB (left panel) and 72 h of infection with shCTR and shNF-YB (right panel). The percentage of Annexin V-positive cells is indicated under each panel. (B) Left panel: DNA agarose gel electrophoresis showing the typical DNA ladder pattern of apoptosis after 48 h of shNF-YA infection. Right panel: expression analysis of cleaved caspase 7 and −9 and PARP1 in NF-YA or NF-YB silenced cells. (C) BrdU/PI cytofluorimetric analysis of HCT116 cells 48 h post-infection with shRNAs. Red dots represent BrdU-positive cells. (D) Left panel: PI (upper panel) and BrdU/PI (lower panel) cytoflurimetric analysis of NF-YA inactivated cells untreated or treated with the pan-caspase inhibitor ZVAD. Blue dots represent non-cycling S cells (S2). Right panel: NF-YA and γH2AX expression analysis of total extracts of shCTR and shNF-YA cells, untreated or treated with ZVAD. Actin was used as loading control.

