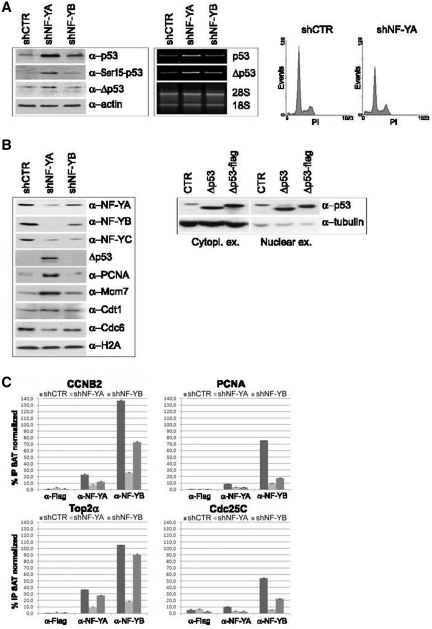
Figure 4.
(A) Left panel: p53, Phospho-Ser15 p53 and Δp53 expression analysis of HCT116 total extracts 48 h post-infection. Actin was used as loading control. Middle panel: RT-PCR analysis of p53 and Δp53 mRNA transcripts. Right panel: monoparametric cell cycle analysis of HCT116 p53−/− cells after shCTR and shNF-YA infection for 48 h. (B) Left panel: expression analysis of chromatin enriched extracts with the indicated antibodies. Right panel: p53 and Δp53 expresison analysis of cytoplasmic and nuclear extracts from HCT116 cells transiently transfected with Δp53 and Δp53-Flag. (C) ChIP analysis of NF-Y binding to the indicated CCAAT-promoters in shCTR, shNF-YA and shNF-YB cells. The enrichment was calculated as percentage IP recovery (%IP) of NF-YA and NF-YB over input normalized to satellite DNA. The input signal consists of 20% of the amount of chromatin used with each immunoprecipitation.

