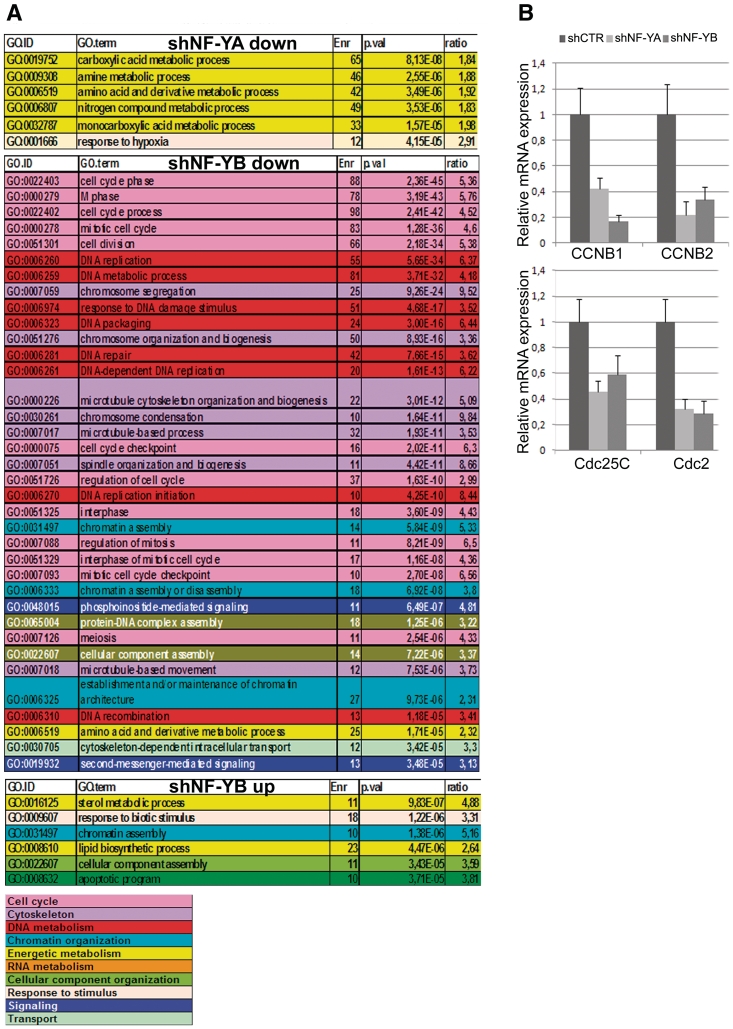
Figure 5.
(A) Gene Ontology (GO) terms displaying a statistically significant over-representation in the sample sets (down- and up-regulated) retrieved from microarray expression analysis of NF-YA and NF-YB silenced versus shCTR cells. Terms have been pruned and grouped according to manually determined macro-categories identified by different colors. (B) mRNA expression analysis of CCNB1, CCNB2, Cdc25C and Cdc2 by real time RT-PCR. mRNA transcripts have been normalized versus TBP and β-actin expression levels.

