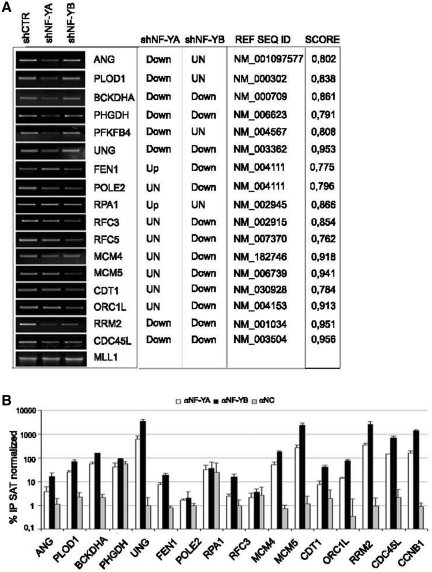
Figure 6.
(A) Semiquantitive RT-PCR validation of the profiling analysis of the indicated transcripts after NF-YA and NF-YB silencing compared to control cells. mRNA transcripts have been normalized versus MLL1 expression levels. The predicted changes of the expression levels from Illumina platform (up, down or unchanged), the Ref Seq ID and the estimated CCAAT score are indicated in the table. (B) ChIP analysis of NF-YA and NF-YB binding to the indicated genes in HCT116 cells. The enrichment was calculated as percentage IP recovery (%IP) of NF-YA and NF-YB over input normalized to satellite DNA.

