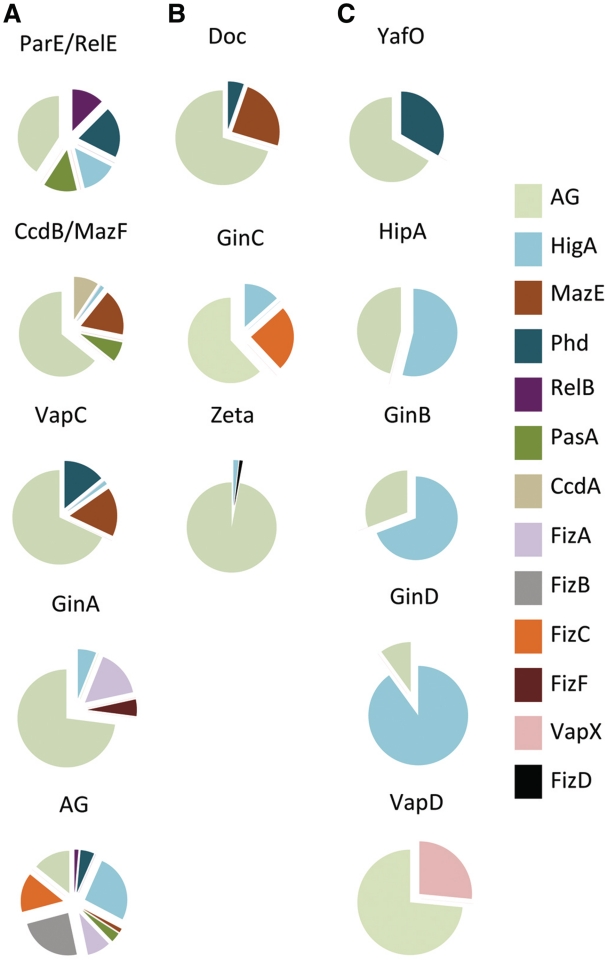
Figure 5.
Associations of toxin super-families. The 12 toxin super-families are indicated above the pie chart. Each section of the pie chart represents the relative abundance of antitoxin sequences belonging to a given super-family associated with toxin sequences. Each antitoxin super-family is represented by a specific color. In (A), toxin super-families that are associated with multiple antitoxin super-families (>4). In (B), toxin super-families that are associated with three different antitoxin super-families. In (C), toxin super-families that are associated with AG sequences and another antitoxin super-family. Associations occurring at less than 1% were not considered for clarity.

