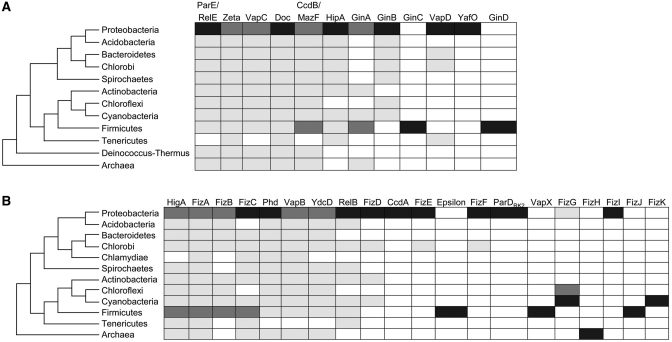
Figure 7.
Phyletic distribution of toxin and antitoxin super-families. Sequences of toxin super-families (A) and antitoxin super-families (B) are detected in the bacterial phyla indicated at the left of the figure in different proportions: not detected (white), 0.1–20% (gray), 20.1–60% (dark gray), above 60.1% (black).

