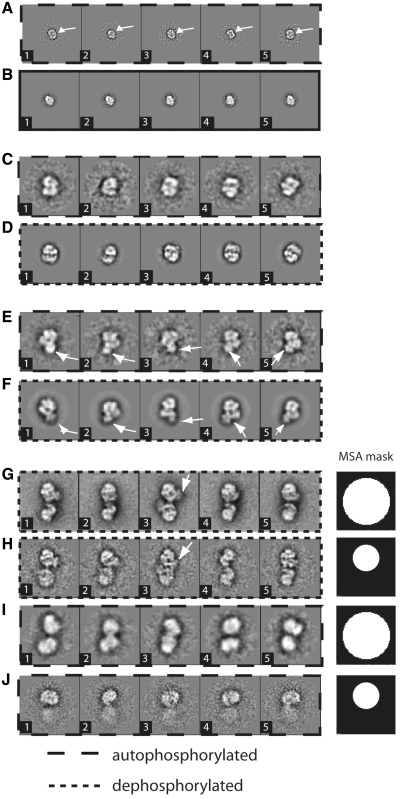
Figure 3.
Summary of current interpretation of the DNA-PK system. (A) Ku70:80 views, current study. The feature of the bridge in the Ku dimer is highlighted with a white arrow. (B) Ku70:80 views (31). (C) DNA-PKcs views, current study. (D) DNA-PKcs views (26). (E) DNA-PK views, current study. (F) DNA-PK views (9). In E and F, the density relative to Ku in the DNA-PK complex is highlighted with a white arrow. (G) Dephosphorylated DNA-PK dimer views (9). (H) Dephosphorylated DNA-PK dimer views obtained by classification with a local mask on the upper subunit, current study. (I) Autophosphorylated DNA-PK dimer views. (J) Autophosphorylated DNA-PK dimer views obtained by classification with a local mask, current study. The white arrows point to the Ku density. Box size = 560 Å.

