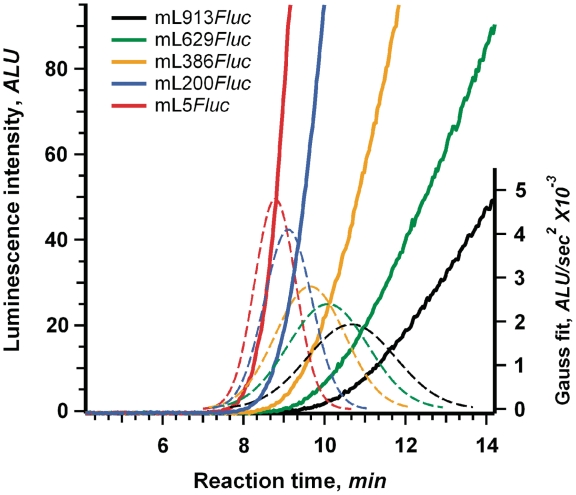
Figure 3.
Determination of full-translation time for mRNAs with different length 5′-UTRs. Time course of luciferase synthesis in the wheat germ system (effective K+ concentration is 35 mM) translating the indicated mRNAs. Dashed lines represent the Gaussian fitting of the second derivatives of the corresponding kinetic curves (see legend to Figure 2).

