Figure 3.
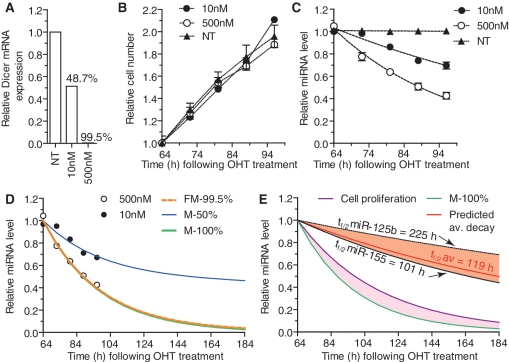
Model of miRNA decay based on experimental measurements. (A–C) Dicer1flox/floxxCre/Esr1 GFP MEFs were plated at low density (10 000 cells per well of a 6-well plate) and treated for ∼16 h with the indicated concentrations of OHT (NT is non-treated). Approximately 64 h following the initial OHT treatment (and every 8 h from then on), some wells were harvested for RNA extraction and cell numbers were quantified using HCSA (‘Methods’ section). (A) GAPDH-normalized wild-type Dicer1 mRNA levels quantified by RT-qPCR were reported to values obtained for NT cells, and used to address the proportion of recombined cells—i.e. Dicer1-deficient cells (indicated in percentage). (B) Average cell numbers relative to those at the initial time-point as determined by HCSA are shown from biological triplicate for each cell type with SEM. (C) For each individual miRNA, the experimental levels at time T following OHT addition were determined by RT-qPCR normalized to that of snoRNA-202 and relative to the levels obtained in NT cells. The values were further reported to the associated non-linear regression curve at T = 64 h (i.e. Day 3) and averages from the six individual miRNAs are shown with SEM. The data are from biological duplicate for each time-point. (D) Mathematical fitting to the experimental data set of average miRNA decay obtained with 500 nM OHT (i.e. with 99.5% recombined cells) is shown by the dashed orange line (FM-99.5%) and allowed for the determination of modelled miRNA decay in 50% and 100% recombined cell populations (M-50% and M-100% curves). Noteworthy, M-50% closely matched the experimental average miRNA decay with 48.7% recombined cells obtained with the 10 nM OHT condition. (E) Following the determination of M-100% and miRNA decay relating to cell proliferation (Cell proliferation—see Modelling in ‘Methods’ section), we determined the ‘absolute’ miRNA decay in a theoretical non-dividing cell (highlighted in purple) for the average of the six miRNAs (Predicted av. decay) and inferred the average half-life of miRNA (t1/2 av = 119 h). The predicted decays of miR-125b and miR-155 are also shown; highlighted in orange is the variation of miRNA decay observed between the six miRNAs analysed. The experimental data used for the modelling are representative of two independent experiments.

