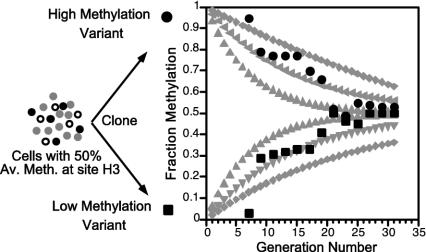
Fig. 2.
Methylation modeling and comparison with experimental data. Modeling (gray curves) was done by using the equation in figure 4 of Pfeifer et al. (7) and various Em, Ed values: 0.90, 0.10 (outer curves); 0.95, 0.05 (middle curves); and 0.97, 0.03 (inner curves). Two curves were calculated for each set of parameters, one starting with an unmethylated site (M = 0, U = 1) and one starting with a methylated site (M = 1, U = 0). The experimental data were obtained by the authors by using mouse cell line BML-2, which was known to be 50% methylated at a specific HpaII site (H3), located near the Igf2 gene but not imprinted (13). Seventeen clones were analyzed for fraction methylation of H3 beginning at generation seven after cloning by using a PCR-based assay with an internal standard (21). As predicted by the stochastic model, the methylation level was quite variable when first assayed soon after cloning. Shown are data from one low methylation clone (▪) and one high methylation clone (•). All 17 clones returned to near 50% methylation by the 30th generation.

