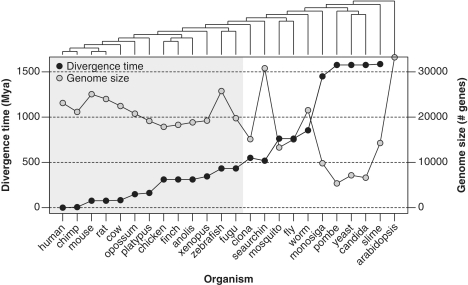
Figure 2.
Phylogenetic relationship for all the species used in this work. In the left Y-axis it is represented the species divergence times (MYA) from human obtained from different sources (combined and averaged), including fossil and molecular distance estimations. In the right Y-axis, it is represented the species genome size, considered as the number of estimated protein-coding genes.

