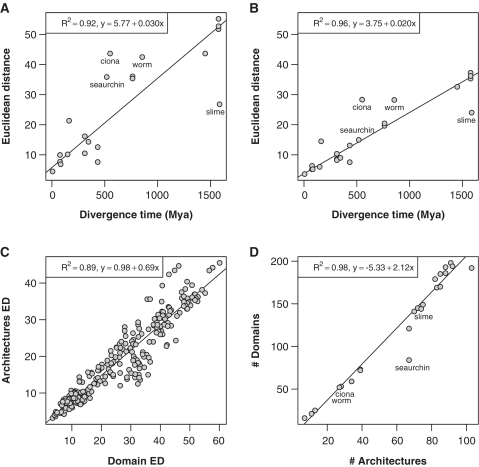
Figure 6.
Comparison of species similarity profiles. (A and B) ED versus divergence time from humans (MYA) for domains and architectures, respectively. (C) Domain versus architecture profile’s EDs among all species. (D) Number of domains versus number of architectures. Outliers (Ciona, slime mold, seaurchin and worm) were removed from the linear fits in subfigures A, B and D, and the corresponding species points labeled. Fitted regression lines and R2 values are also shown for all the plots.

