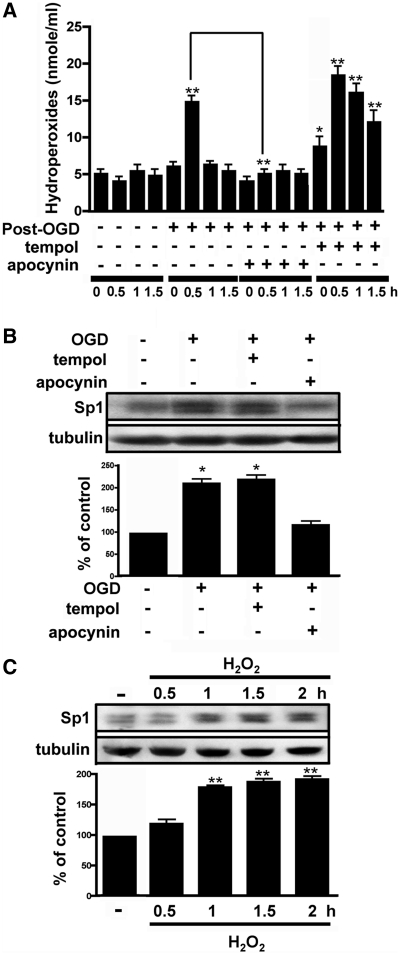
Figure 2.
Role of H2O2 in Sp1 expression. (A) Primary neurons treated with either normoxia, OGD, OGD with apocynin or OGD with tempol. Total lysates were prepared at the 0.5-, 1- and 1.5-h time points after the recovery from OGD. The concentration of H2O2 was measured as described in Materials and Methods. (B) Cultured cortical neurons were pre-treated with either apocynin or tempol 1 h prior to OGD treatment. Further, the cells were harvested 4 h after treatment, immunoblotting was performed with anti-Sp1 antibodies and tubulin was used as an internal control. The Sp1 expression level was quantified in three independent experiments. (C) Total lysates of the primary neurons were obtained at various time points following H2O2 treatment. Sp1 expression was detected by western blotting using anti-Sp1 antibodies and using tubulin as an internal control. The values represent the mean ± SD. In (B and C), statistical analysis was carried out using the one-way ANOVA with appropriate post hoc tests. *P < 0.05, **P < 0.01 versus the naïve control group.

