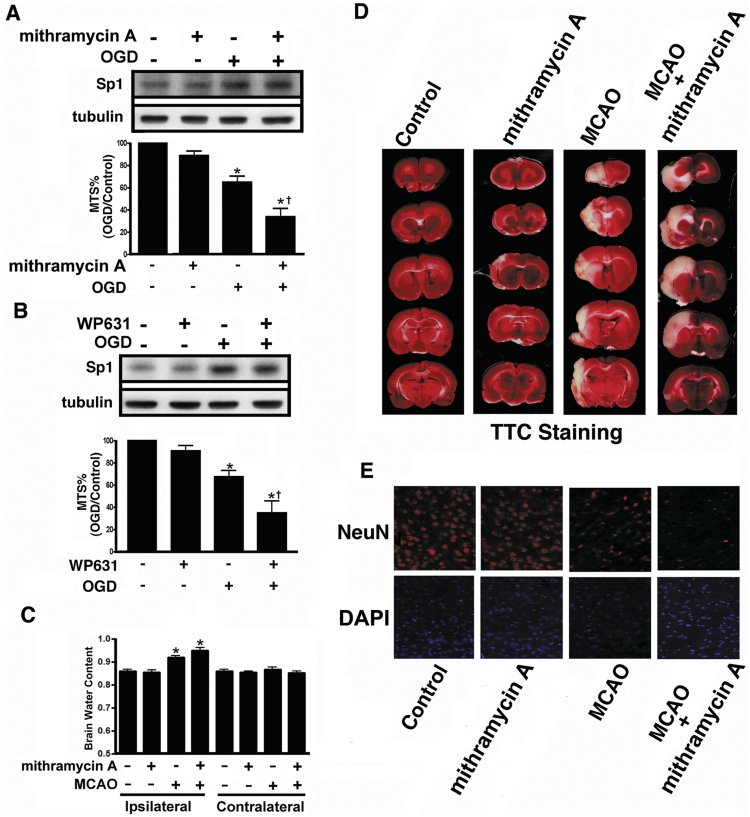
Figure 6.
Effects of Sp1 inhibitors on brain injury after hypoxia/ischaemia challenge. (A and B) Primary neurons were treated with mithramycin A (A) or WP631 (B), followed by OGD treatment. Viability of the cultured cortical neurons was assessed by MTS assay in which Sp1 expression level was used as an internal control. Experiments were carried out independently in triplicate. The values that were normalized to the protein content are provided as the mean ± SD (n = 3) and are expressed as percent viability relative to untreated cells. Statistical analysis was carried out using one-way ANOVA with appropriate post hoc tests. *P < 0.05 versus the naïve control group; †P < 0.01 versus the OGD group. (C) Hemispheres were separated and weighed immediately after removal and again after drying in an oven at 105°C for 24 h. Data are presented as mean ± SD (n = 4). (D) Infarct area was evaluated by TTC staining. Representative sections from the indicated treatments after 4 day of recovery are shown. (E) Brain sections were obtained 4 day after MCAO recovery, probed with anti-NeuN antibodies and detected with Alexa 568 (red). The nucleus was stained with 4′, 6-diamidino-2-phenylindole (DAPI; blue). Scale bar, 50 μm. Statistical analysis was carried out using one-way ANOVA with appropriate post hoc tests. *P < 0.05 versus the sham-control group.

