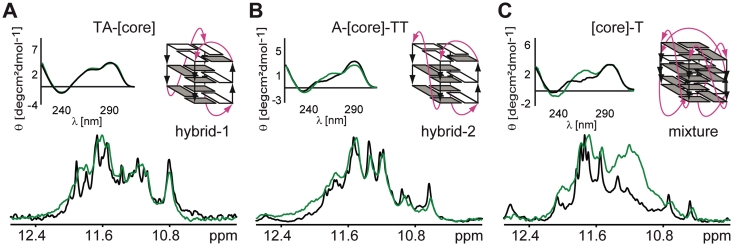
Figure 3.
Overlays of CD spectra and imino regions of 1D 1H 11-echo NMR spectra for [TA-core], [A-core-TT] and [core-T] constructs in intra-oocyte buffer, and in intra-oocyte buffer supplemented with 40% Ficoll are shown, accompanied by schematic representations of the assumed G-quadruplex conformations (A–C). Loops are colored magenta; anti and syn guanines are colored grey and white, respectively.

