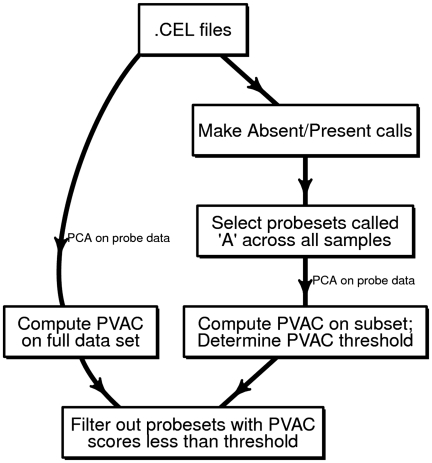
Figure 1.
A diagram of the work-flow for performing PCA-based filtering. For each probe set, the PCA is performed on the background corrected, quantile normalized probe-level data matrix, where the probes are in columns and samples in rows. The proportion of variation accounted by PC1 was extracted and used for measuring concordance of probes. A cutoff was chosen based on the distribution of the same statistic among a subset of probe sets that are called ‘Absent’ across all samples by the MAS5 algorithm. See the ‘Materials and Methods’ section for details.

