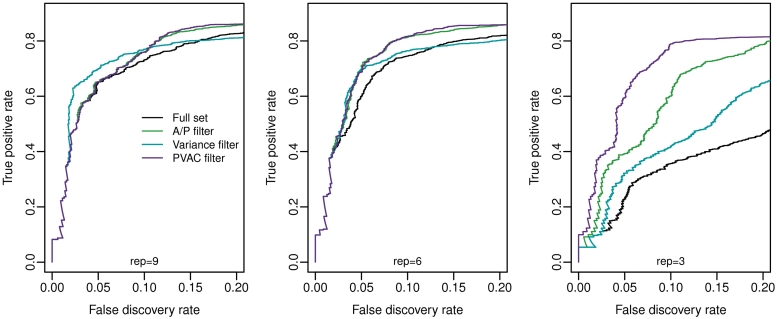
Figure 2.
Power comparisons of different filtering methods by ROC curves based on the spike-in data set. Here the proportions of true DEGs detected are drawn against the observed FDRs, derived from applying various filters and performing the two-sample t-test. Note that the comparisons were performed on the full data set with nine replicates in each group (left), a subset of samples with six replicates (middle) and a subset with three replicates (right).

