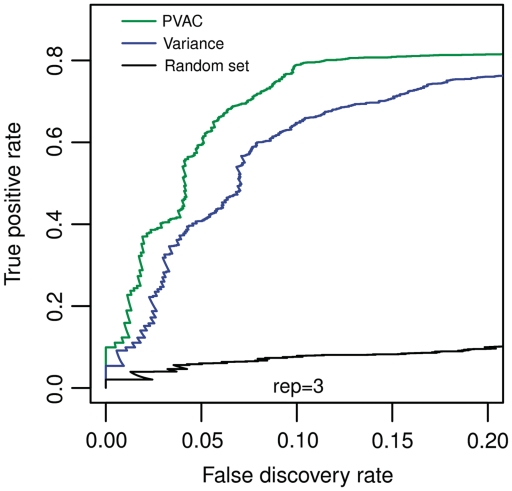
Figure 3.
Power comparison between the variance and the PCA-based filters given a fixed number of filter-passing genes. By adjusting the threshold value of the ranked overall gene-level variances, the same number of genes as those passing the PVAC filter (n = 3 848) were chosen for statistical testing. The power comparison through ROC curves is based on the same subset of data (with n = 3) as shown in Figure 2, right hand side. For comparison, a random set with the same number of probe sets were drawn and compared to those from the variance and PVAC filters.

