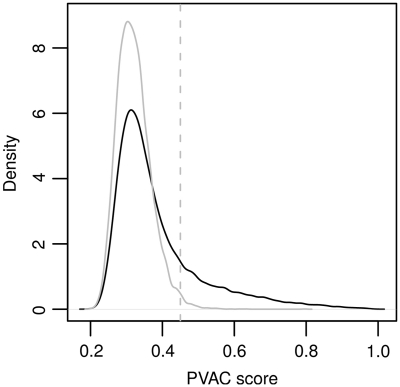
Figure 6.
Overall distribution of the PVAC scores from the diabetes data set. The distribution of the observed PVAC scores is plotted (in dark), along with the density of the PVAC scores from the probe sets called ‘Absent’ across all samples, i.e. the non-expressed sets (in gray). The gray vertical line indicates the 99 percentile value from the non-expressed sets, which is chosen as the threshold for filtering.

