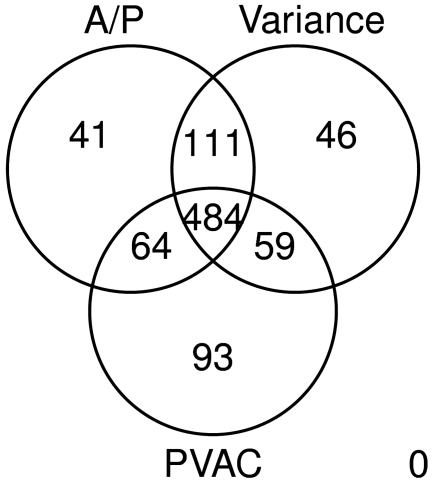
Figure 7.
Venn diagram of the lists of top ranked genes from various filters. Here the top ranked genes (n = 700) identified as differentially expressed (FDR < 0.05) in the diabetes data set are compared after applying the A/P filter, the variance and the PVAC filters. The same filtering procedure were chosen as those used in Figure 2 (see ‘Results’ section for details).

