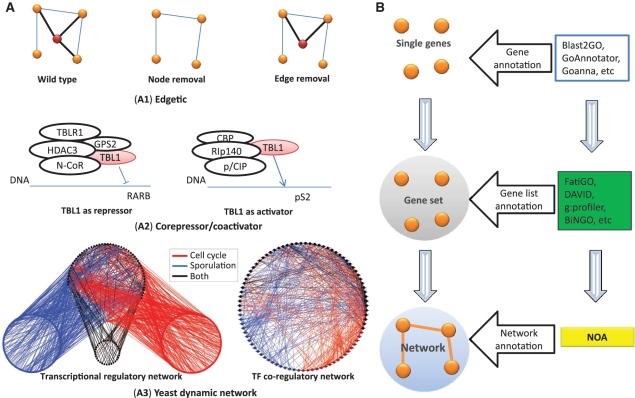
Figure 1.
Schematic examples to illustrate the motivation of NOA. (A) Schematic examples to illustrate the motivation of considering interactions in functional enrichment analysis. Here, we list three situations where gene list based methods fail. (A1) illustrates the concept of ‘edgetic’ (21). Many complex diseases are caused by edge removal instead of node removal from wild type. The red node is an important protein related to some kind of disease. Although the concentration of the protein does not change, mutation causes an interaction broken, and leads to disease. This cannot be detected by single gene or gene list based analysis. (A2) shows that TBL1 has fundamentally different functions when joining different transcriptional complexes by acting as either co-repressor or co-activator (22). The blue line stands for DNA. (A3) is an example for network rewiring of yeast transcriptional networks (19). We show the yeast transcriptional regulatory network in the left and the corresponding TF co-regulatory network in the right. Interactions or genes are colored as red if they are active in cell cycle, blue in sporulation, and black in both processes. (B) Three levels of ontology analysis. Gene ontology is based on the information of sequence, structure, phenotype, etc. to infer the function of single genes or gene products. Gene list ontology analysis performs enrichment analysis in a gene list based on hypothesis testing. Most tools such as FatiGO, DAVID, g:profiler and BiNGO are in this level. Our NOA addresses the problem of network ontology analysis and conceptually belongs to the biological network level.

