Fig. 7.
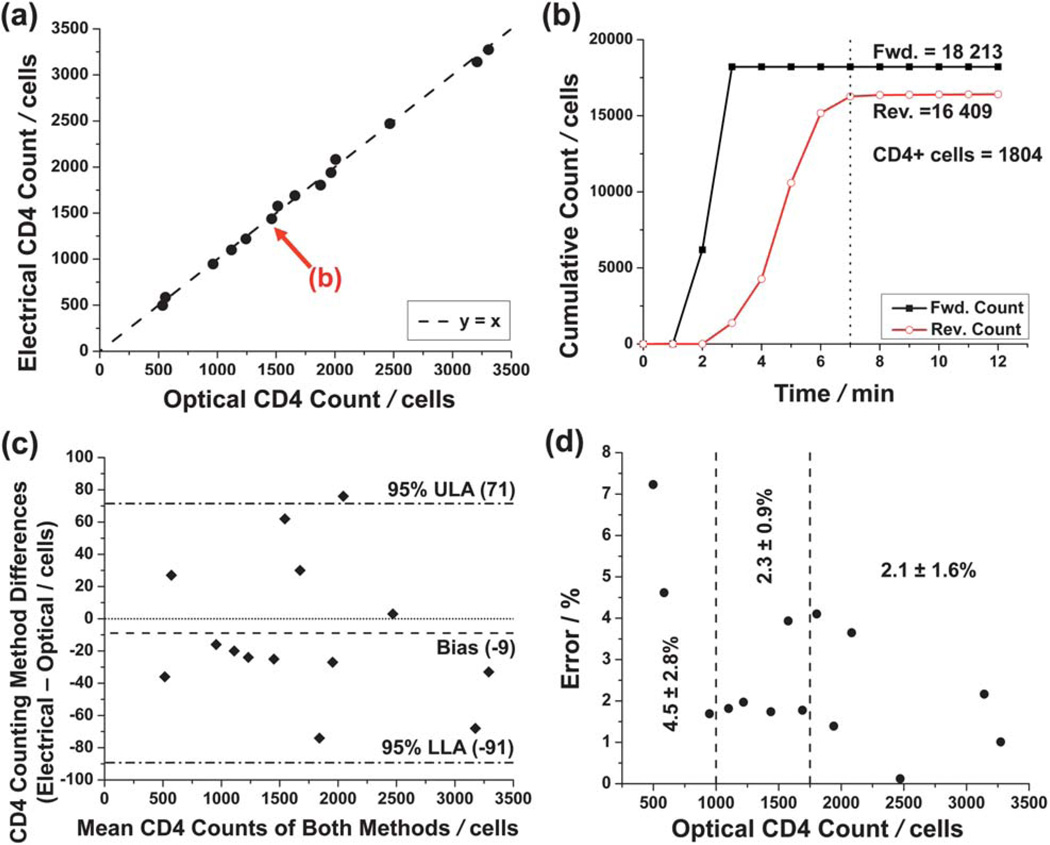
Reverse-flow differential counting of CD4+ T lymphocytes. (a) Comparison of electrical differential counting method and the optical controls. A linear fit (R2 = 0.997) is not shown, as it is would be indistinguishable from the y = x correlation standard. (b) Cumulative counts of forward and reverse-flow regimes for the particular experiment highlighted in (a). The absolute number of captured CD4+ T cells was found simply by subtracting the reverse count from the forward count. The dotted line denotes a completed analysis (where reverse counting levels off) duration of approximately 7 minutes. (c) Bland–Altman analysis of the data in (a). The dash-dot lines denote upper and lower levels of agreement (ULA and LLA, respectively). The dashed line shows a bias of 9 cells toward the optical method. (d) Counting error decreases as the total number of captured CD4+ T cells increases. Listed statistics are for three regimes demarcated by dashed lines: 0 to 1000 captured helper T cells (0 to 200 cells per µL, assuming 5 µL of sample flowed into chip), n = 3; 1000 to 1750 (200 to 350 cells per µL), n = 5; and greater than 1750 (>350 cells per µL), n = 6.

