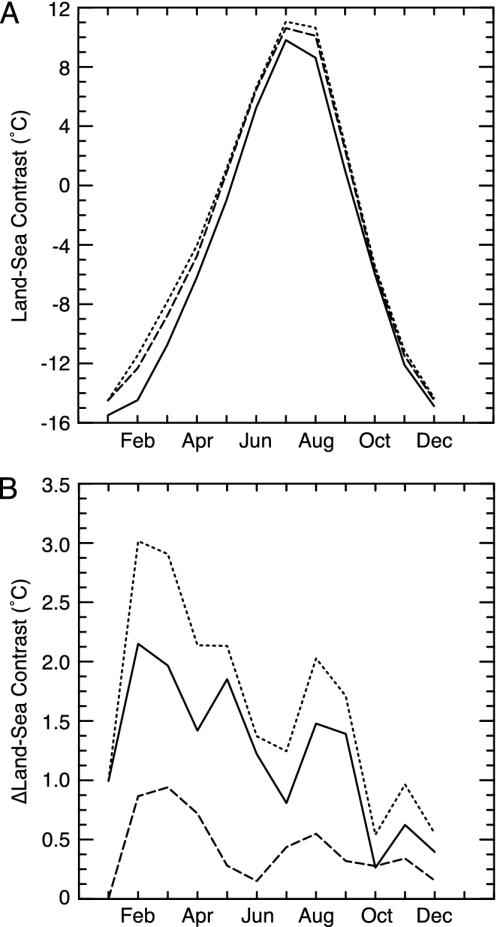
Fig. 1.
Simulated land–sea temperature contrast and anomalies. (A) Land–sea temperature contrast (calculated as land – ocean) for the CONTROL (solid line), 2XCO2 (large dashed line), and 2XCO2 + VEG (small dashed line) cases. (B) Anomalies in land–sea temperature contrast calculated as 2XCO2 – CONTROL (solid line), 2XCO2+VEG – 2XCO2 (large dashed line), and 2XCO2+VEG – CONTROL (small dashed line). A buffer of eight grid points was discarded from each side of the rectangular RCM domain. Land temperatures were calculated from all RCM land grid points within this buffer. Sea temperatures were calculated from all RCM ocean grid points within this buffer.

