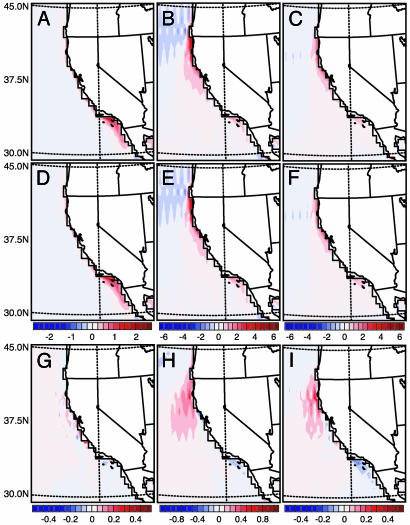
Fig. 2.
Simulated California Current wind-stress curl. (A) May curl in the 2XCO2+VEG case. (B) August curl in the 2XCO2+VEG case. (C) September curl in the 2XCO2+VEG case. (D) May curl in the 2XCO2 case. (E) August curl in the 2XCO2 case. (F) September curl in the 2XCO2 case. (G) May curl anomalies calculated as 2XCO2 – CONTROL. (H) August curl anomalies calculated as 2XCO2 – CONTROL. (I) September curl anomalies calculated as 2XCO2 – CONTROL. Units are 10–7 N/m3. Continental areas in the RCM are shown in white. Two coastlines are shown. The jagged line represents the RCM coastline. The smooth line represents the actual coastline. RCM grid boxes are 40 × 40 km.

