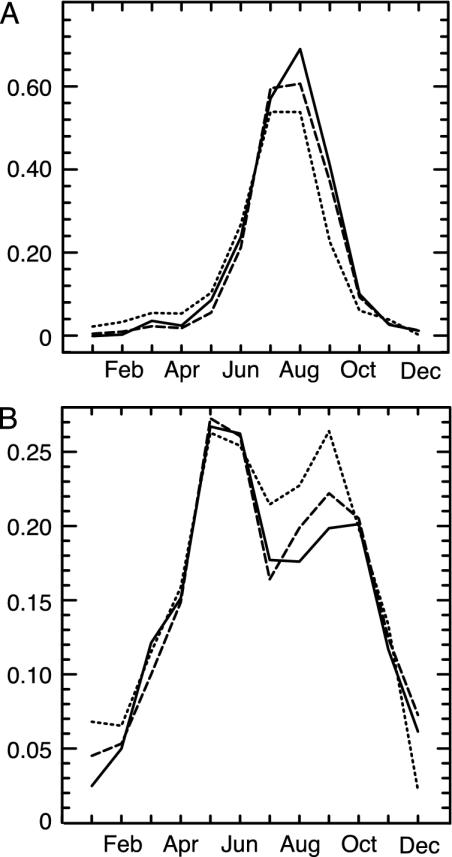
Fig. 4.
Regional response of the California Current to radiative forcing and land-cover–atmosphere feedbacks. Values of wind-stress curl in the CONTROL (small dashed line), 2XCO2 (large dashed line), and 2XCO2+VEG (solid line) cases were averaged over a band of six ocean grid points along the coast. (A) Northern limb (34°Nto42°N). (B) Southern limb (29.6°Nto34°N). Latitudinal definitions of the northern and southern limbs were based on the placement of the Southern California Bight (34°N) and Capo Blanco (42.5°N) on the RCM grid (see Fig. 2).

