
Fig.4. Nitrogen stress promotes Atf1-dependent chromatin remodeling at cgs2+ promoter.
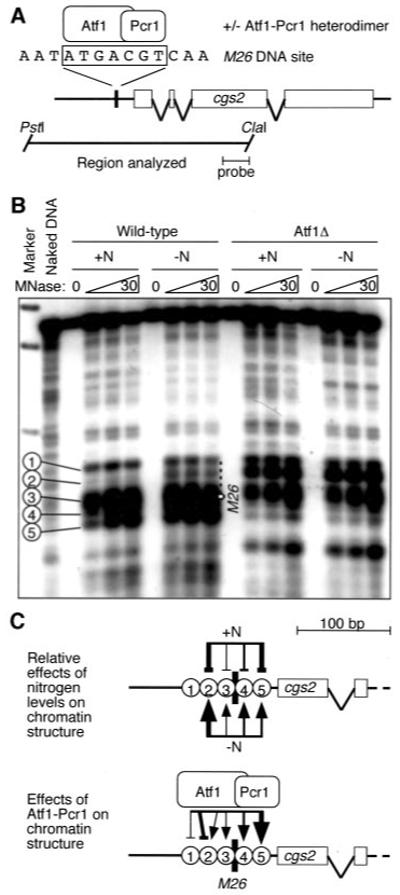
A, diagram of cgs2+ locus showing locations of M26 DNA site and DNA fragments analyzed. B, chromatin structure of cgs2+ revealed by micrococcal nuclease digestion and indirect end labeling. Balloons indicate five prominent hypersensitive sites of the promoter region that are affected by nitrogen starvation and/or Atf1-Pcr1 heterodimer. C, summary of stress-induced, Atf1-Pcr1-dependent chromatin remodeling: positive (arrows) and negative (bars) effects are indicated, and the line width indicates magnitude of the effect.